Clients
The Clients section lists all clients that are registered to your tenant.
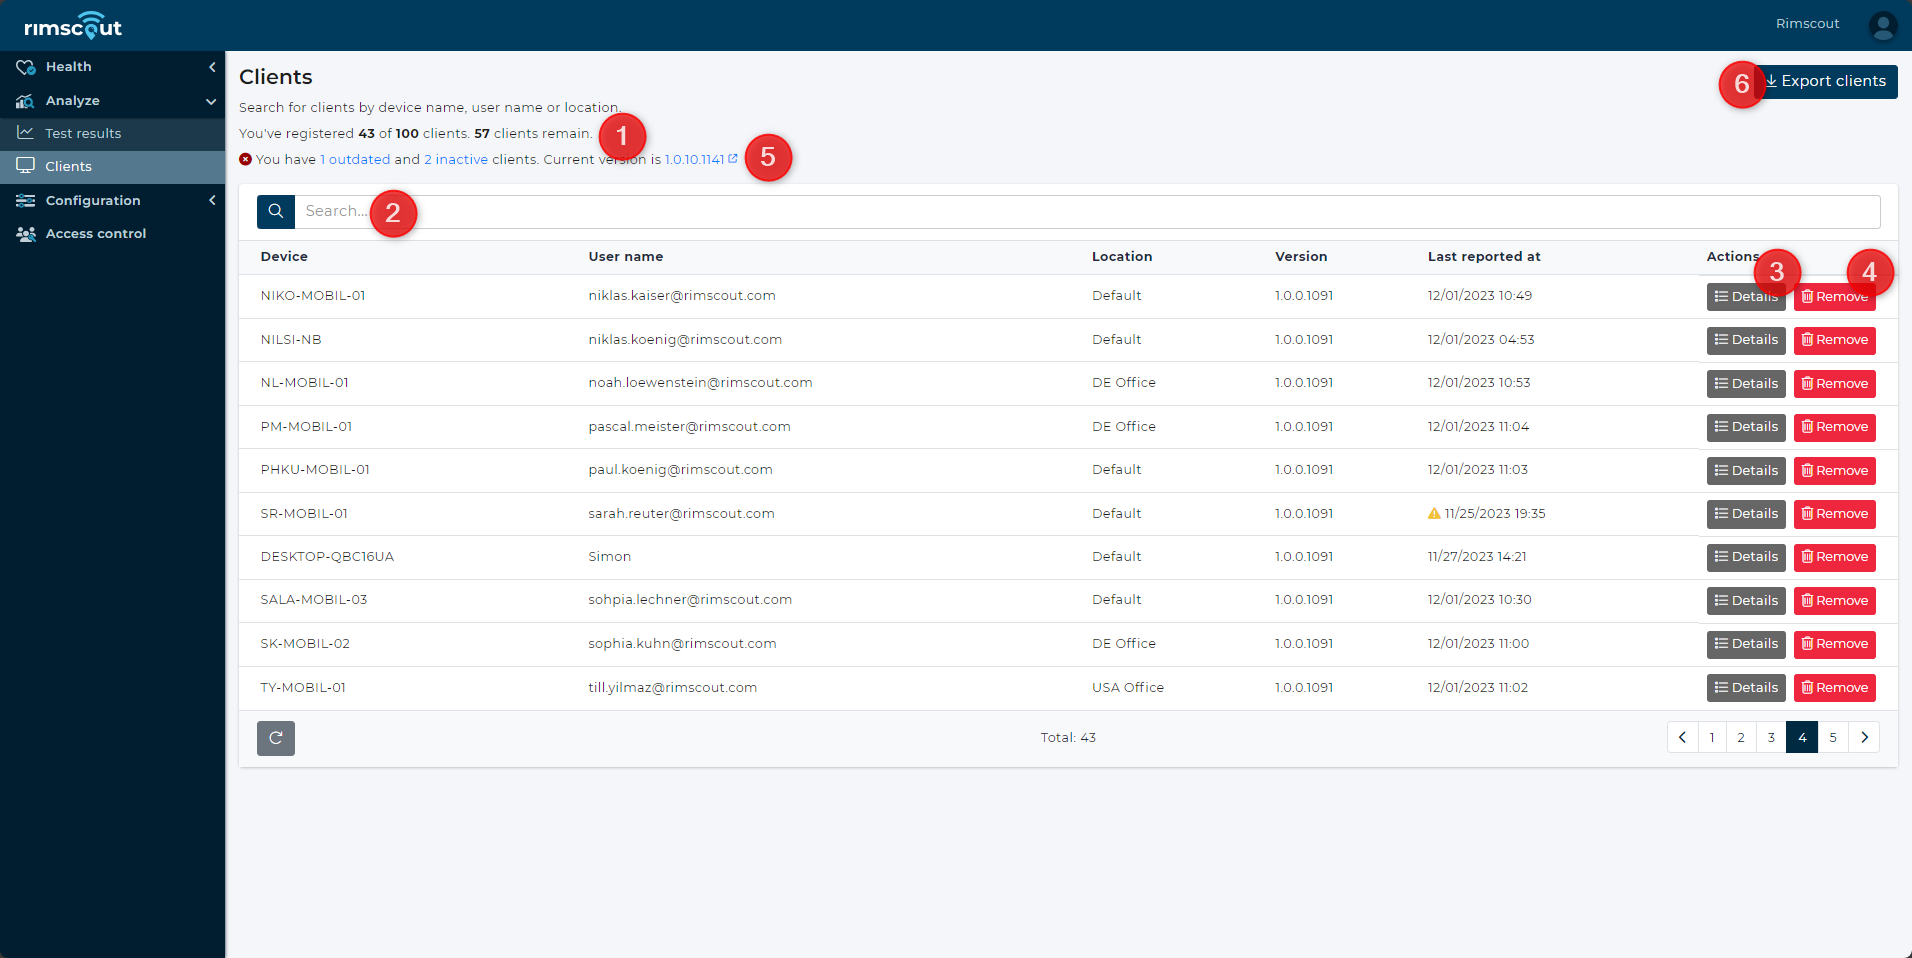
- Check your registered client count and remaining installations before reaching the license limit.
- Search for clients by device name, user name or location.
- Click
Detailsto view and analyse each client’s data. - Click
Removeto delete unused clients. Note: This won’t stop an active client, but only removes its data and portal access. - Check the notification for outdated or inactive clients and filter for them by clicking on the highlighted words.
- Export a CSV of recent system profile data for all clients.
Client details
With a click on the Details button in the clients list one can view all data on different tabs.
The datetime picker on the top right can be used to inspect past data.
| Tab | Description |
|---|---|
| Overview | Shows the latest reported status of the client and gives a quick overview of its connection. |
| Health | Displays the client's health of the selected day. |
| System profile | Lists all collected system configuration and network environment information. |
| Analyze | Let's one analyse correlations between test problems and system profile data. |
| Traceroute (coming soon) | Shows the hops of executed traceroute tests. |
Overview
The overview tab gives a first overview of a client.
The client status section shows the latest status of the client's connection and provides general information about the client.
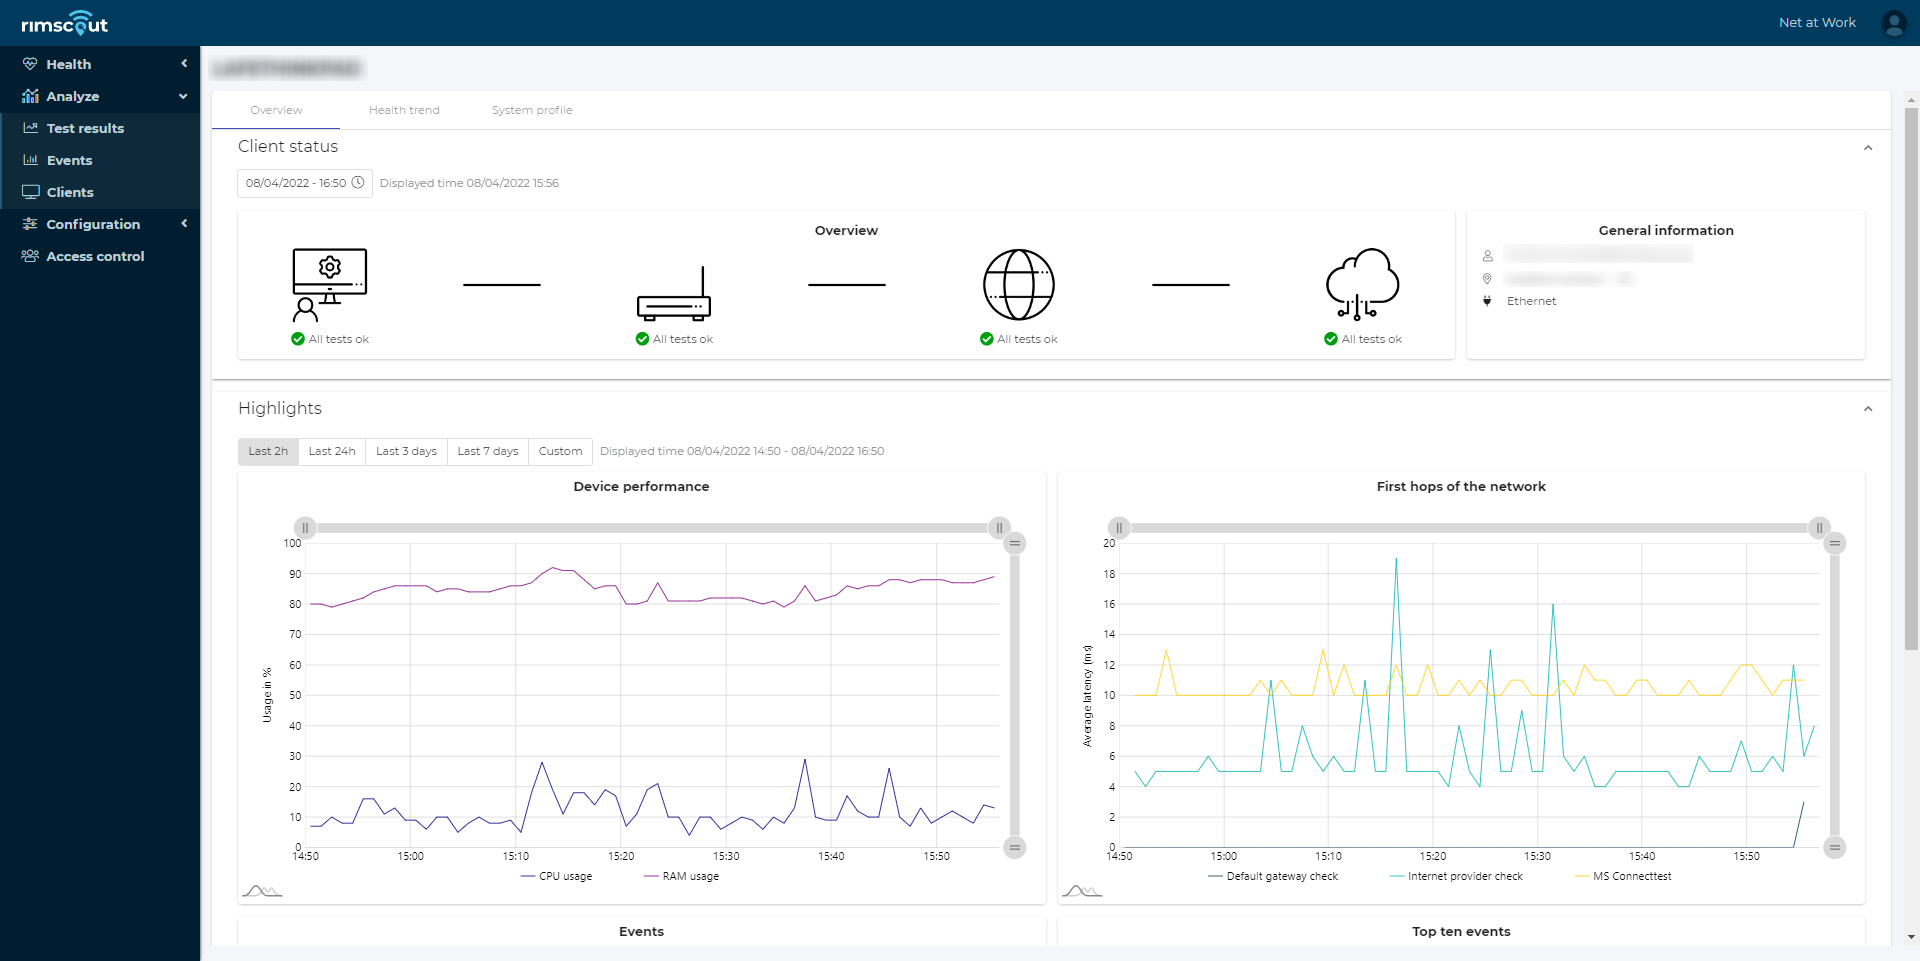
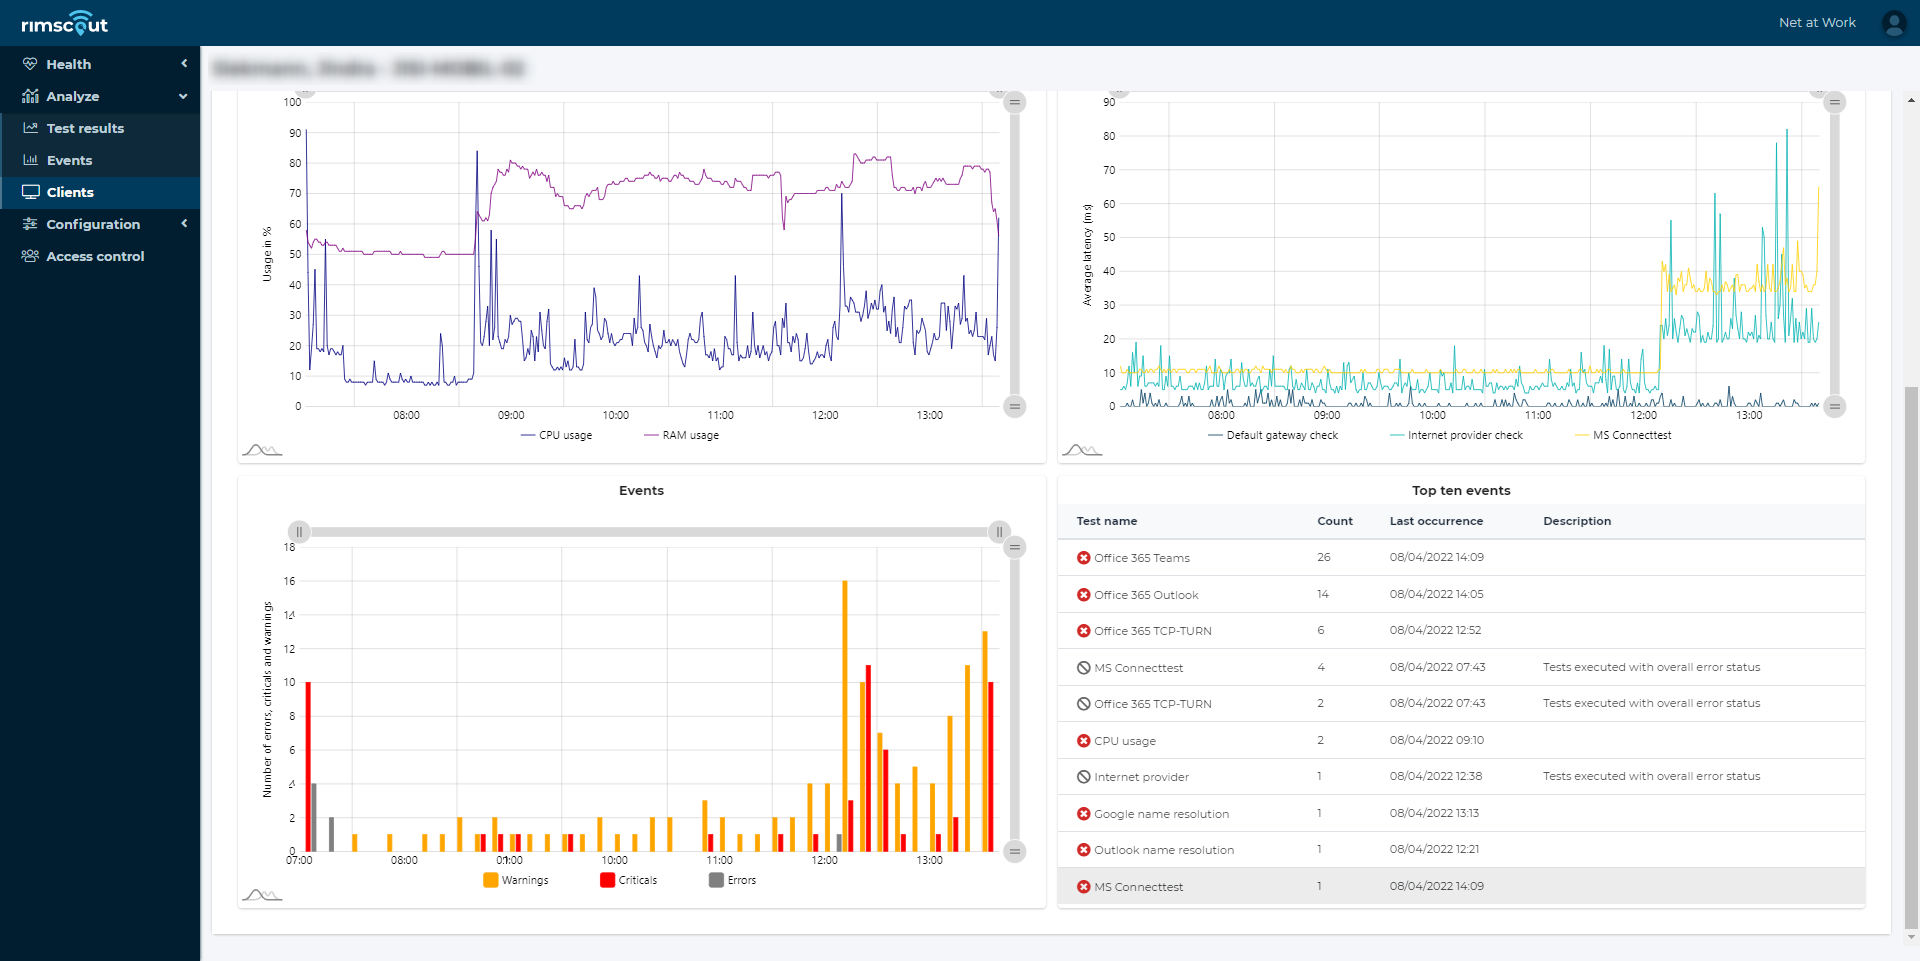
The highlights section displays the performance of selected tests to hint for possible network bottlenecks or performance issues on the client. The events chart and top ten events table display all test issues and their frequency during the selected time range.
The time range can be chosen among predefined values like Last 3 days or can be set to a custom range.
Health
The client health gives an overview of the client's connection status over the day. Yellow, red or grey columns indicate that the client reported several issues within 15 minutes chunk. A click on one health chart directs to the test results where the exact measurements can be inspected.
See the Health documentation to learn how to use the charts.
If you determine a test at the client's health with issues that occur only from time to time, then those issues could be related to some network or system configuration of the client's device. This can be inspected in the Analyze section (see below).
System profile
The System profile tab shows the network environment and system configuration data of the device a client runs on. The system profile data is also shown on the client (see System profile).
The date selection can be used to display any past system profile data.
To inspect whether test issues are related to changes in the system profile data, one can use the Analyze tab.
Analyze
The Analyze section lets you inspect whether issues of a test are related to changes in the system profile data. To find any of those relations:
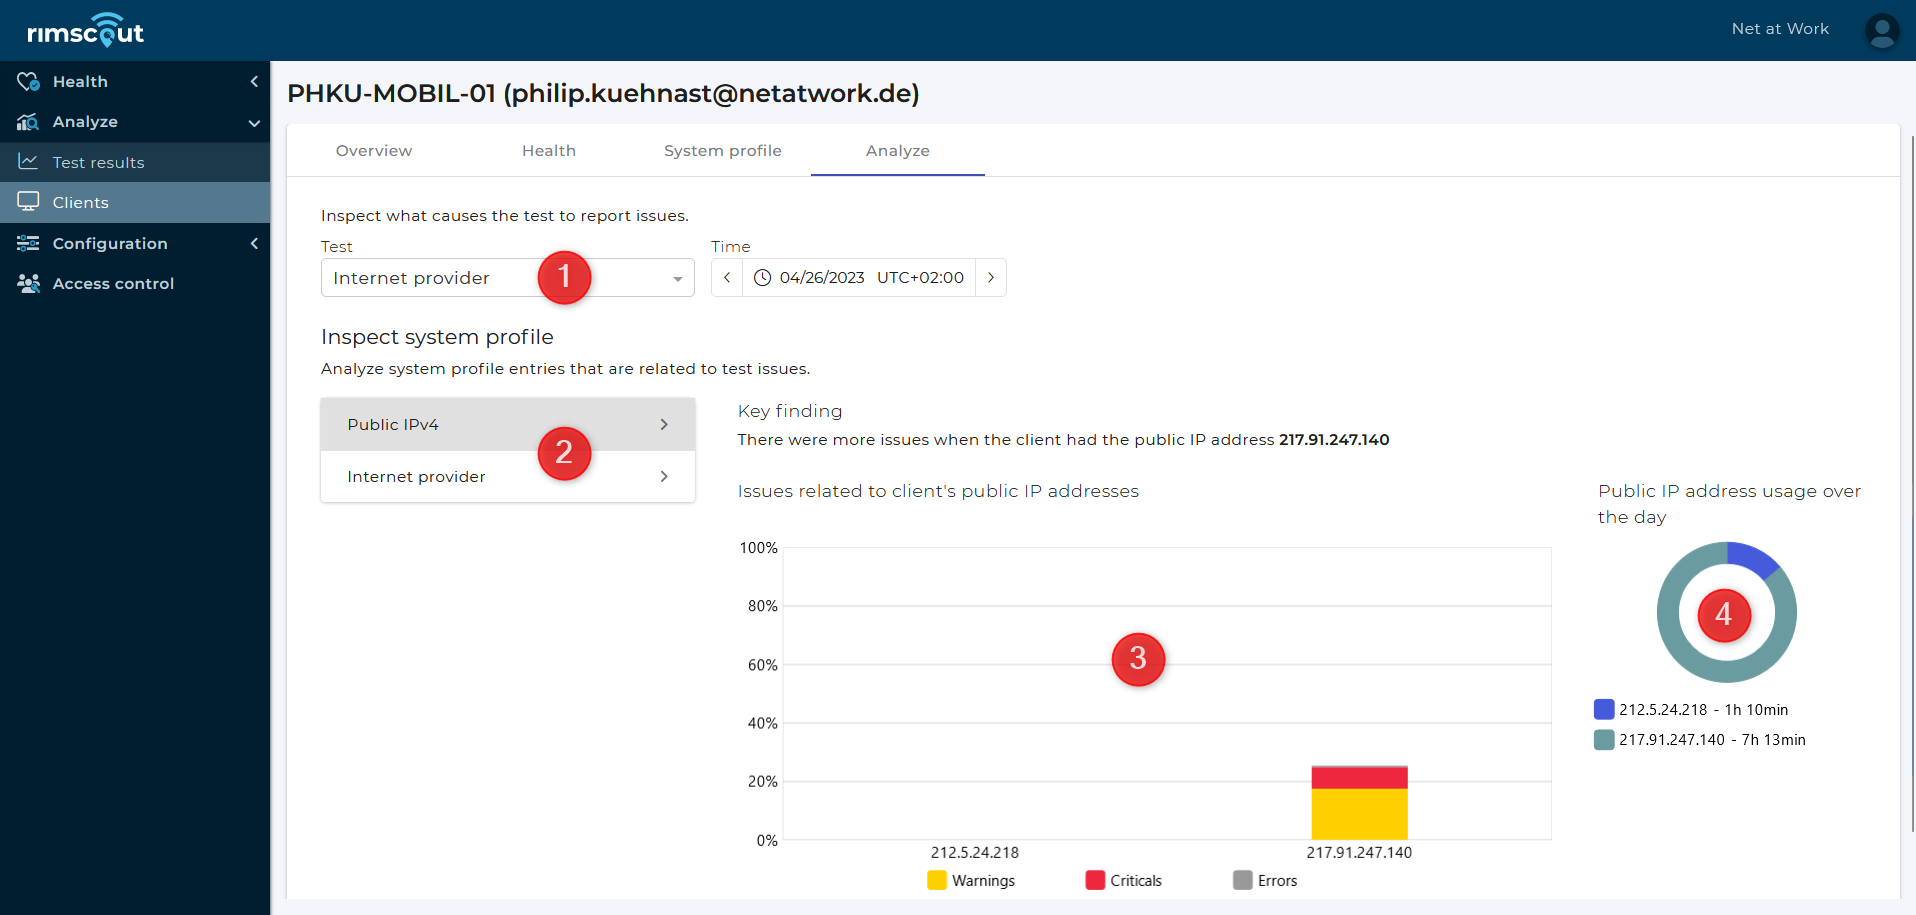
- Select the test you want to analyze.
- All possibly related system profile entries are then listed below. Click on one for details.
- The column chart shows how many issues were reported for each configuration. The number of issues is relative and shows how many test results were unsuccessful over the time the configuration was used.
- The pie chart shows how much time each of the configurations was actually used by the client over the day.