Issue details
The issue details page provides a centralised overview of an issue, including its occurrence over time and the affected clients.
What is an "issue"?
An “issue” is a specific problem detected for a client when monitored tests report non-successful results. These issues are identified by examining the client’s data over 15 minutes, similar to the Health. The detection of an issue is not solely dependent on individual tests but could be a result of a combination of tests states and may involve checks of the system profile data.
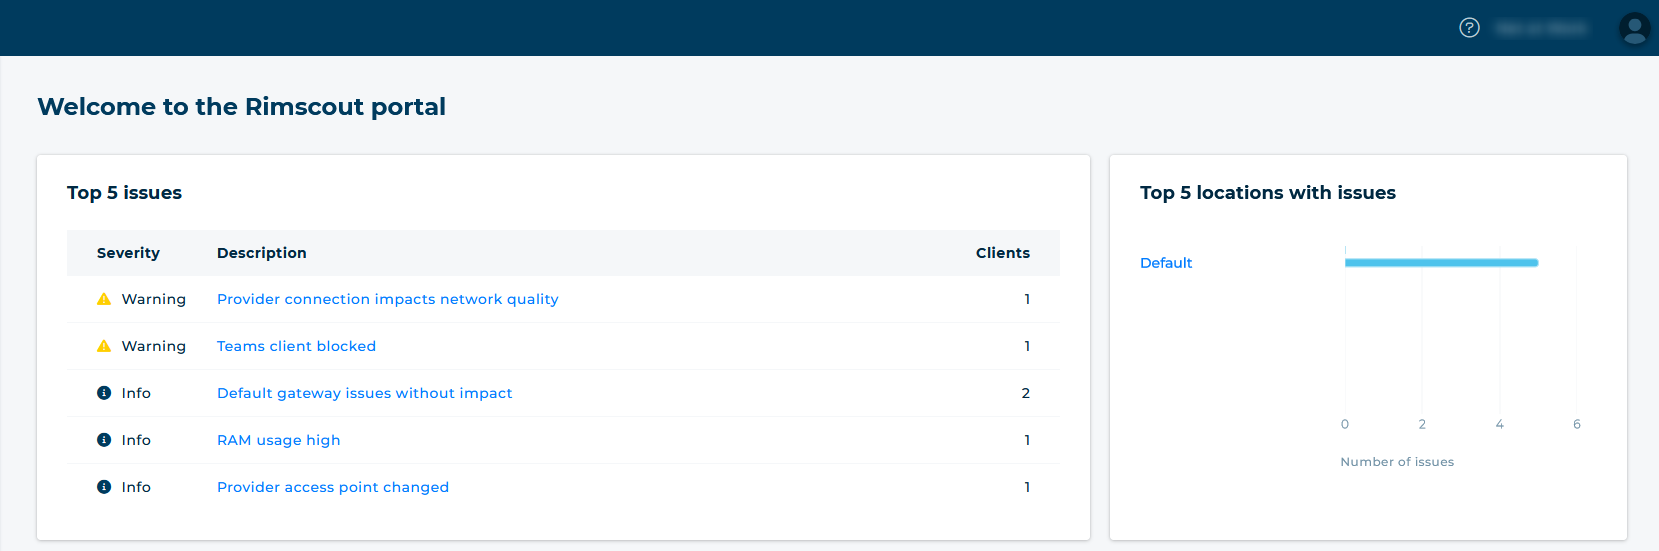
Accessing the page
To view the issue details page, click an issue title on the Location overview or Landing page.
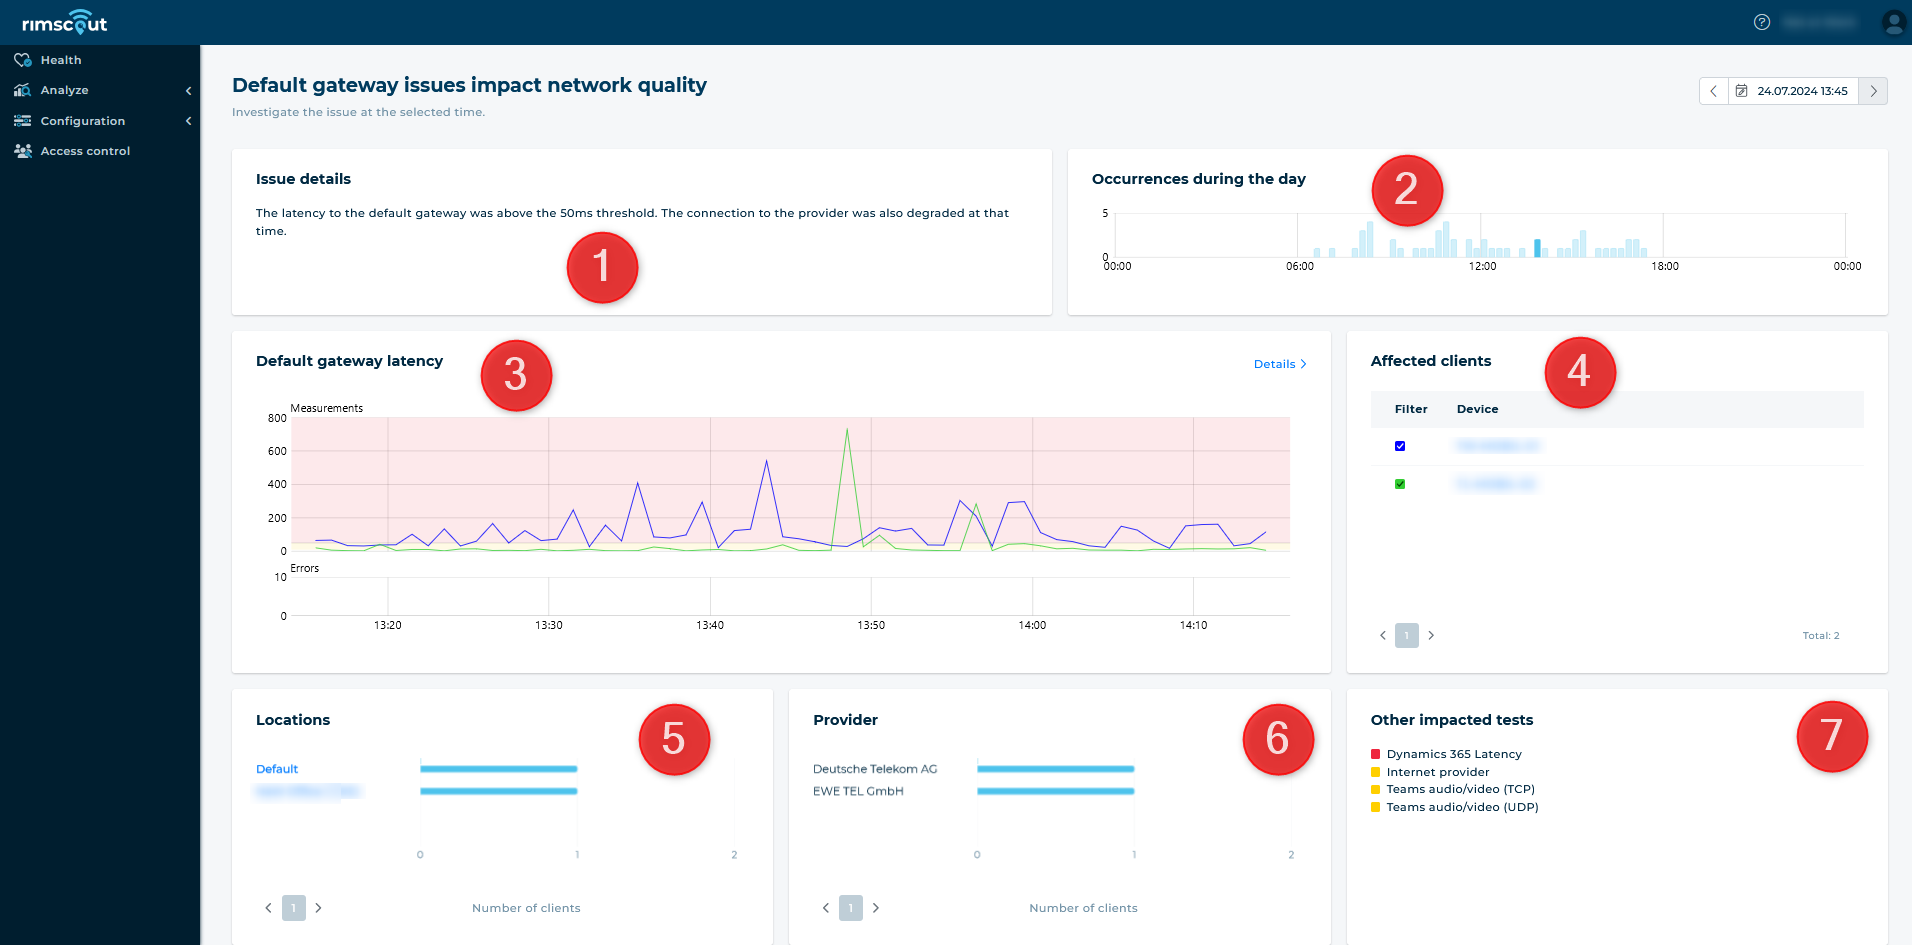
Widget overview
The page contains several widgets, each providing different insights:
| No. | Widget title | Description |
|---|---|---|
| 1 | Description | Briefly summarises the issue by naming the test that detected the issue and describing the nature of the issue (e.g. exceeded thresholds, packet loss or non-responsive target). |
| 2 | Occurrences over the day | A chart that displays the number of clients that reported the issue throughout the day, useful for understanding the issue’s duration and impact. |
| 3 | [Test name] latency | Shows the test results of the affected clients at the selected time, allowing to understand why the issue is reported. |
| 4 | Affected clients | Lists all clients that reported the issue at the selected time. Clicking on a client name will display their detailed data. |
| 5/6 | Location / Provider | These charts display the locations and providers used by the affected clients. |
| 6 | Impacted tests | Lists all tests that reported issues concurrently and are related to the current issue. |
Time selection
By default, the time selected on the previous page (e.g., the current time on the Landing page) is preselected. To view the issue at different times, use the Occurrences chart to select another time within the day when the issue was reported. You can also use the datetime picker at the top of the page to switch between days.
Investigate test results
Upon accessing the Issue details page, the test results of the first 5 affected clients are displayed on the Latency chart. You can modify this selection by checking the boxes in the affected clients list. Hovering over a client in this list will highlight their test results.
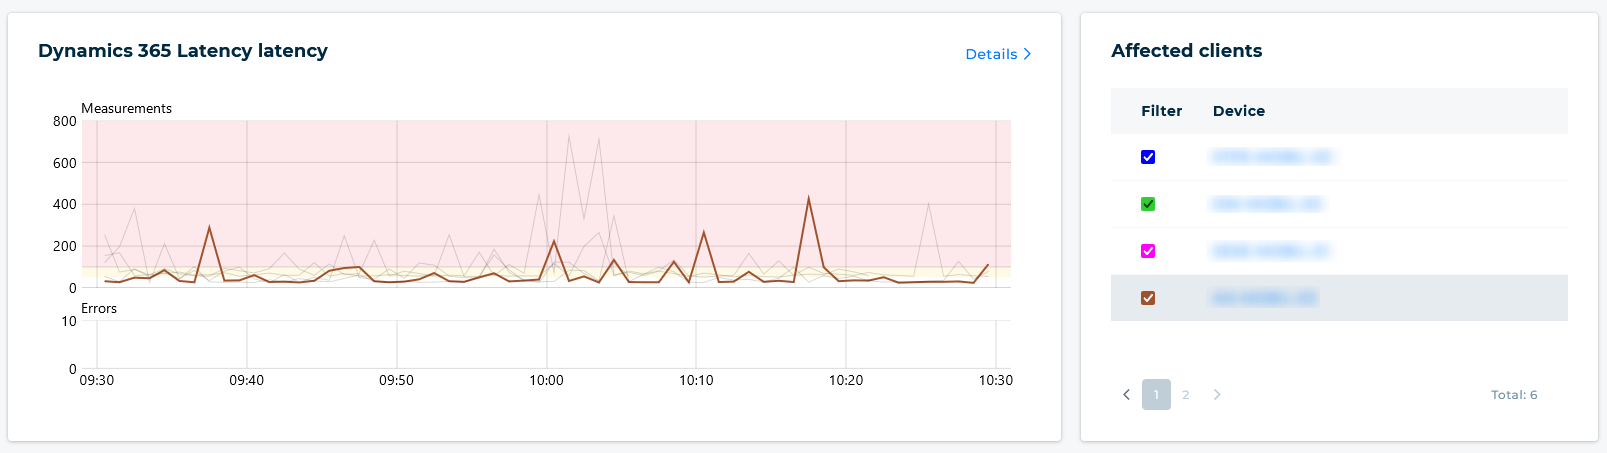
For a more in-depth analysis of the test results, click on the Details button on the Latency chart. This will take you to the Test Result chart, where the results of the previously selected clients are displayed. Here, you can add more clients for comparison or inspect other times.
Info
The Latency chart on the issue details page displays up to 5 clients’ test results, while the Test result page allows up to 20.