Test results
The test result chart can be used to display and compare the test result of any client and test. Analyze trends and outtages in detail, understand errors or compare compare clients and locations.
Add client data
- Click on Add clients
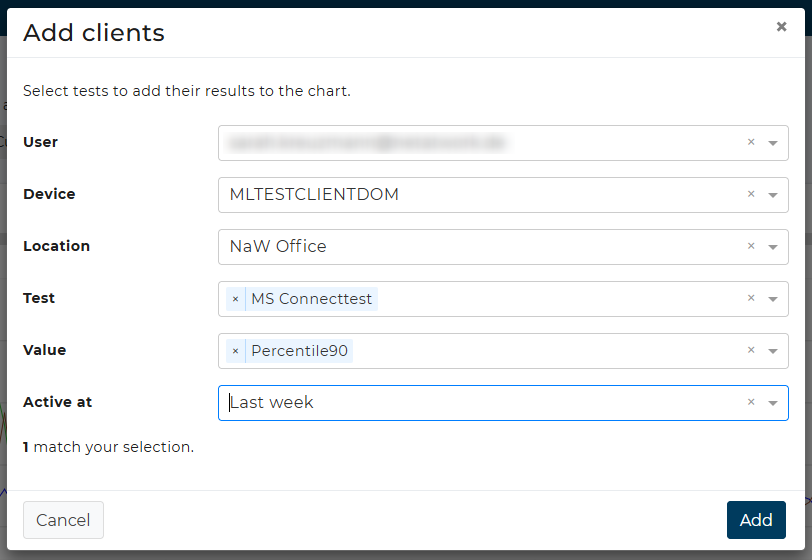
- In the popup window, filter by the clients and test results that you want to add.
- Filter by a User or Device name to select a specific client.
- Filter by a Location to get the results of all clients at that location.
- Filter by one or more Tests to only show the results of the selected tests.
- Filter by one or more Values to select a calculated metric of the test results.
- Select a time period for Active at to filter by clients that were active at that period.
- Be aware that you can add only a limited number of test results to the chart (at most 20).
- Click on Add to load the test results to the chart.
- The selected test results are listed in the table below the chart.
Info
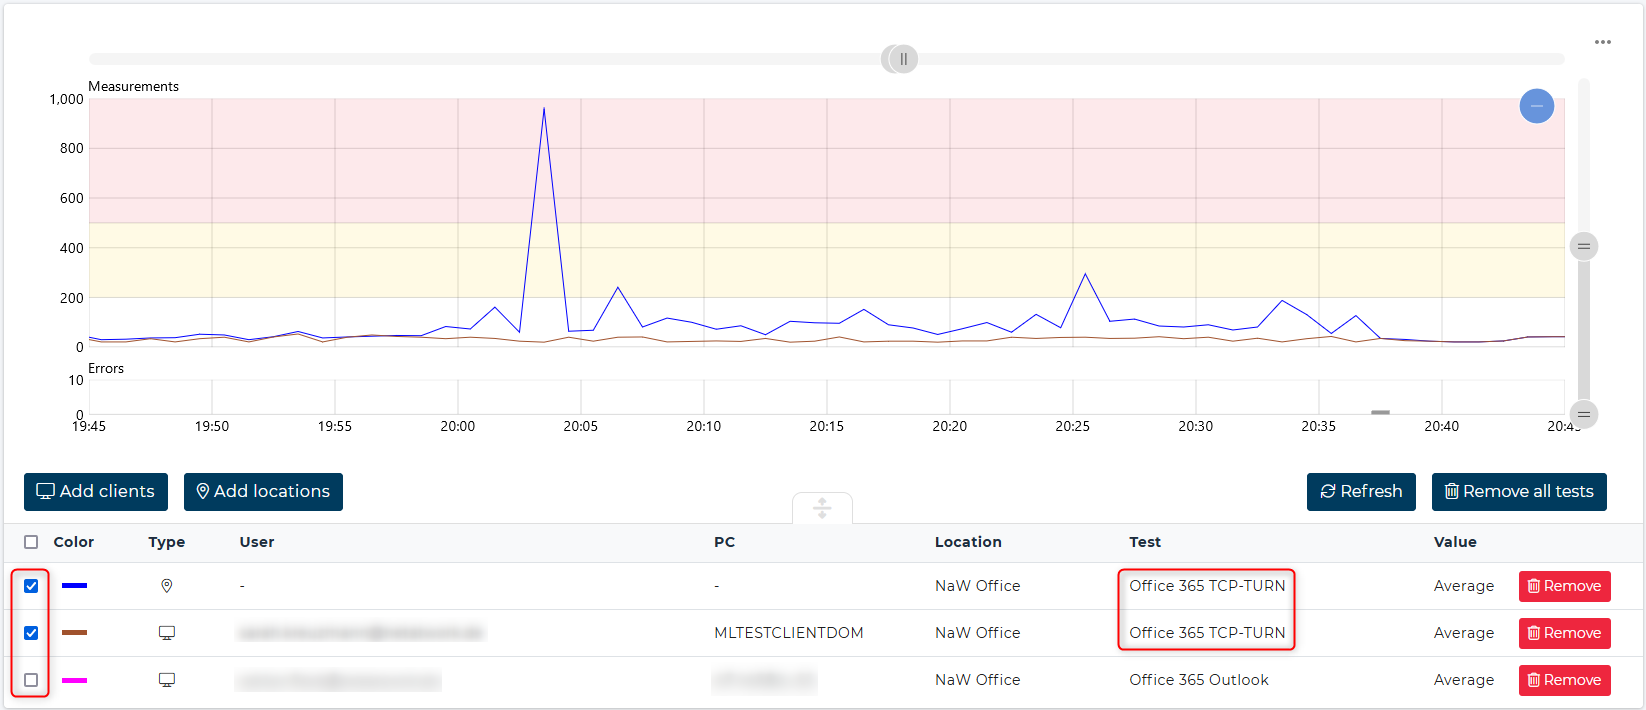
By unchecking/checking the checkboxes of the shown test results you can show or remove the results from the chart.
Add location averages
Location averages can be used to compare clients and locations with one another. They are calculated by averaging the test results of all clients at one location.
- Click on Add locations
- In the pop-up window, filter for the location averages that you want to add to the chart.
- Select one or more Locations to filter the locations.
- Select one or more Tests to only select the averages for the selected tests.
- Be aware that you can only add a limitted number of test results to the chart (at most 20).
- Click on Add to load the averages to the chart.
Select time period
The time period can be selected at the top of the chart.
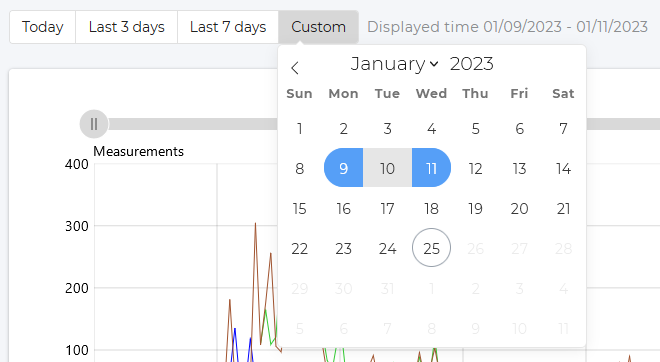
Use one of the pre-configured options like Last 3 days or set your timespan individually with the Custom option.
The date picker allows you to select any day within the last 30 days and a period not exceeding 7 days.
Show thresholds
The warning and critical thresholds of a test are displayed as background colors if the results of only one test are selected.
If results of different tests are selected for comparison, the thresholds are not shown.
Show error details
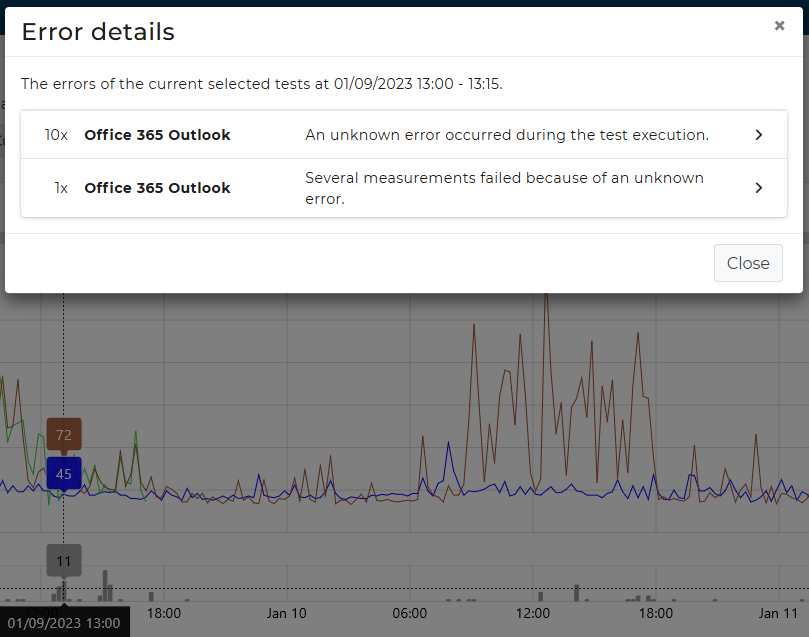
The chart shows underneath the Measurements the Errors section.
The number of all reported errors of the selected tests are shown here.
Clicking on one column opens a popup with details of the occurred error.
Save selected test results
To save the list of selected client tests simply save the URL. If you load that URL again, the test results for the same clients and tests will be displayed on the chart.
Export test results
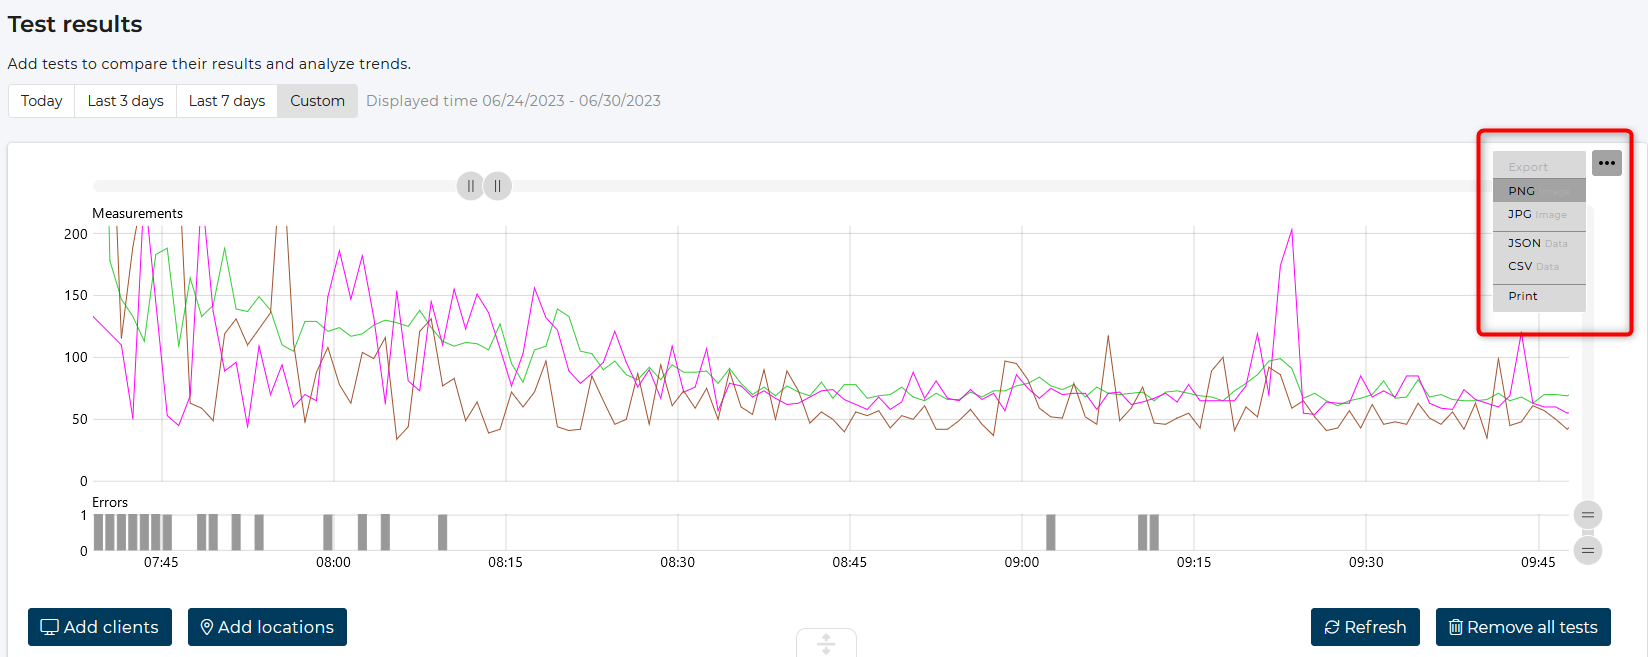
Export the chart's test data as an image, CSV, or JSON format using the export menu found as three dots in the top right corner.
