Alerts
Alert rules can be created to get notifications when clients report issues. The alert system uses the health of tests or services to evaluate the issues.
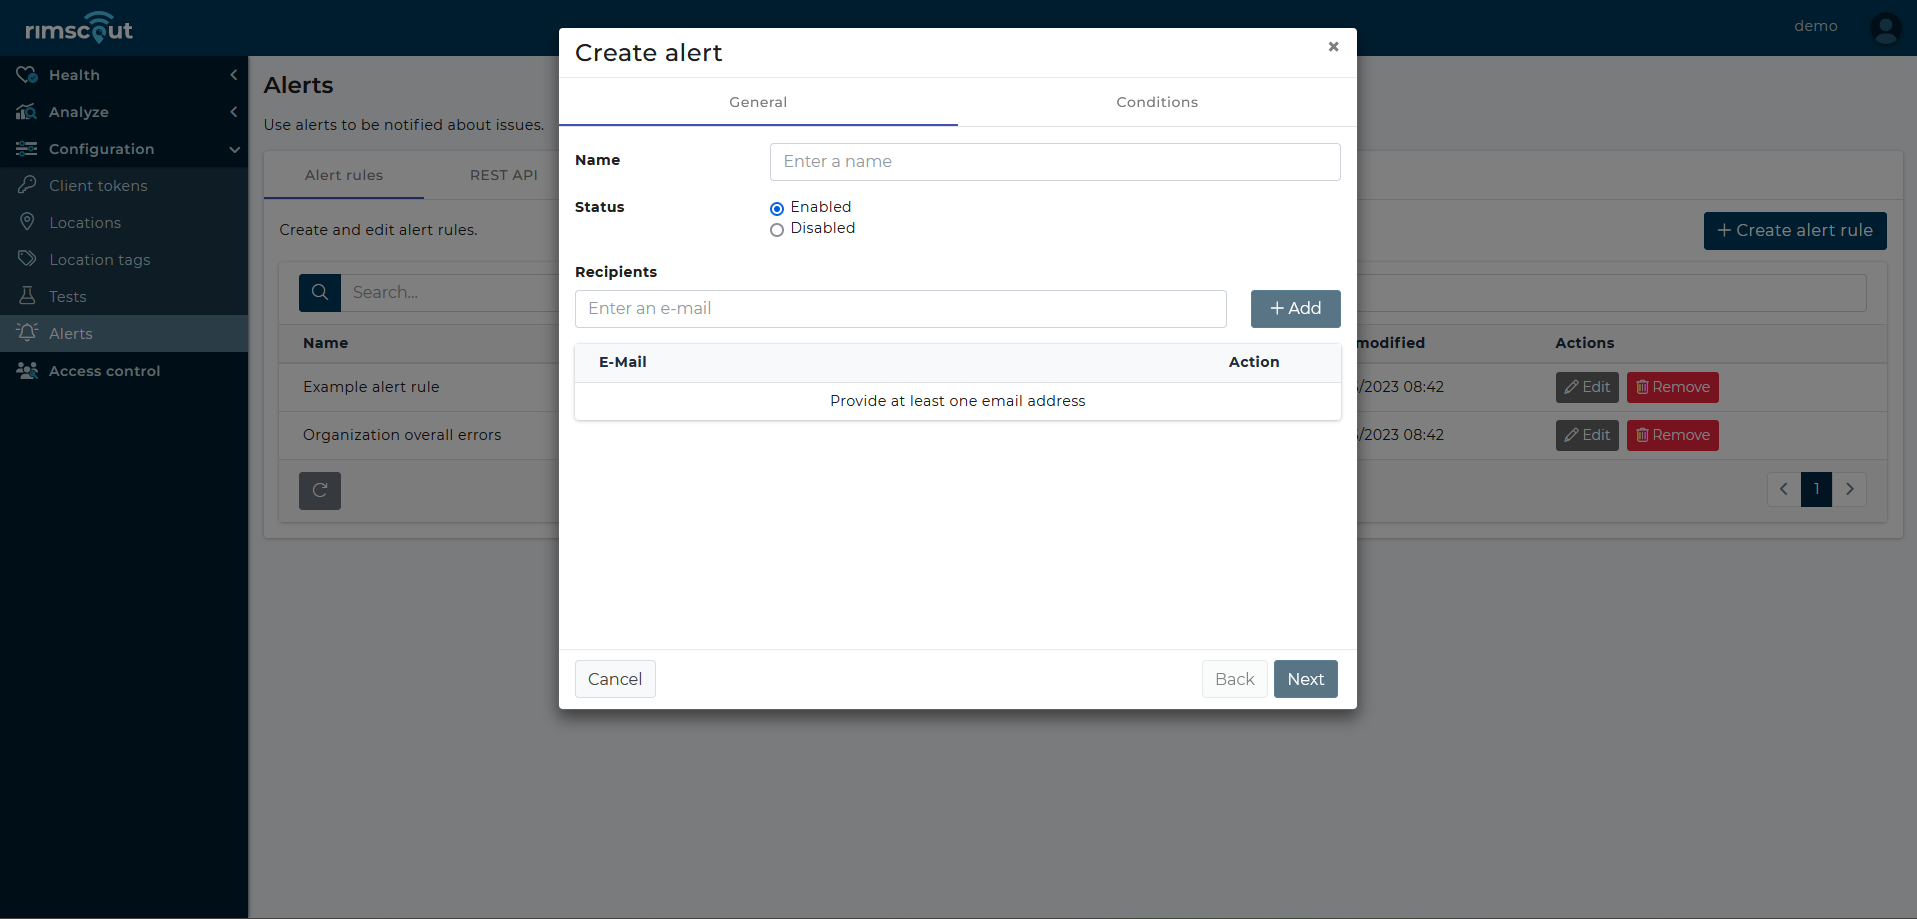
Create an alert rule
- Navigate to
Configuration > Alerts - Click on the Create alert rule button.
- Choose a unique name and decide whether the alert rule should be enabled or disabled.
- Add the email address of everyone who should be notified to the Recipients list.
- Then click Next to specify the Condition that will trigger an alert.
- Choose a scope. Choose if only issues of a single client, clients at a location or all clients are considered.
- Choose a target which can be any service or test that is present on the health charts.
- Choose the health statuses that you want to be notified about.
- Choose the lookback time. 15 minutes relates to one column in the health charts.
Important remarks
- Only tests and services that are shown on the health charts can be selected as target.
- Whether an alert rule should be triggered is checked every quarter of an hour.
- An alert condition basically relates to a health chart. An alert rule checks the latest column(s) of that chart and whether the status matches the selected status of the alert condition.
Alert API
The alert API is a REST API that provides information about all currently active alerts. It can be used for integration with other monitoring tools or notification systems (e.g. PRTG).
General usage
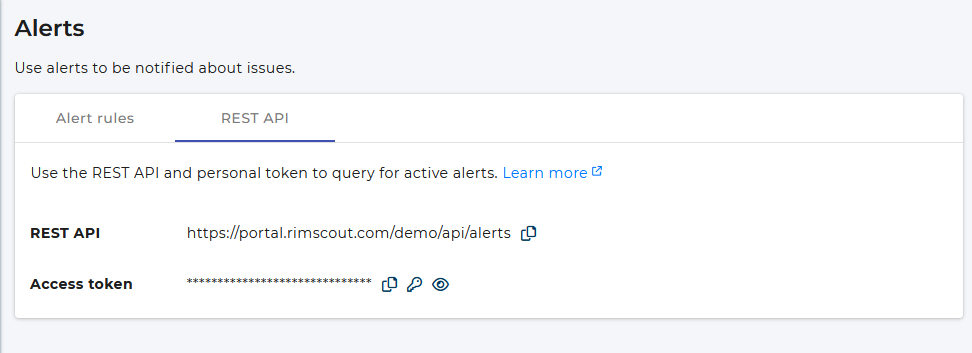
The URL for the API endpoint can be found under the Alerts API tab on the APIs page in the Rimscout portal.
- Query the provided URL via an HTTP GET request.
- Provide the header field X-Access-Token and set the access token on the
Alert APItab as its value. - Specify the format of the respone via the Accept header field. Either
application/xmlorapplication/jsonare accepted.
Response
The response contains a count for the number of currently active alerts and provides details about them. An example in xml format is shown below with comments for the parameters.
<rimscoutapi>
    <countActive>1</countActive> <!--Number of currently active alerts -->
    <lastEvaluated>2023-04-12T14:00.000Z</lastEvaluated> <!-- Date and time of the last check for active alerts -->
    <alerts> <!-- List with details for all currently active alerts-->
        <alert>
            <id>1</id>
            <name>My alert</name>
            <startDateTime>2023-04-12T13:45:00.000Z</startDateTime> <!-- Date and time when the alert was triggered -->
            <acitveForMinutes>18<acitveForMinutes> <!-- Duration for which the alert is active in minutes -->
            <lastHealthStatus>critical</lastHealthStatus> <!--The last status of the target's health -->
            <lastModified>2023-04-10T11:23:14.000Z<lastModified> <!-- Date and time the alert configuration was last modified -->
            <conditions> <!-- List of conditions that triggered the alert. Currently there is always one condition. -->
                <condition> <!-- The configuration of the condition -->
                    <scopeType>Organization</scopeType>
                    <scopeValue></scopeValue> <!-- empty in case the targetType is 'Organization' -->
                    <targetType>Service</targetType>
                    <targetValue>Teams</targetValue> <!-- empty in case the targetType is 'Overall' -->
                    <healthStatus>critical</healthStatus> <!-- the selected health status to be notified about -->
                    <timeMinutes>30</timeMinutes> <!-- lookback time in minutes -->
                    <healthLink>https://portal.rimscout.com/mytenant/app/health?utc=12042023</healthLink> <!-- The link to the corresponding health page in the Rimscout portal-->
                </condition>
            </conditions>
        </alert>
    </alerts>
</rimscoutapi>
PRTG example
This example gives a quick introduction for integrating the alert API into PRTG.
1) Retrieve API endpoint and token
- Go to https://portal.rimscout.com/app/alerts
- Click on the tab REST API
- Use the URL and token on that page to query for your active alerts.
2) Create script for PRTG sensor
- Create a new powershell script in the suiting PRTG folder.
- In this script, query the active alerts using the URL and access token.
- Then build an XML structure the way PRTG should display the alerts.
Below is an example of such a Powershell script.
# define parameters for the API request
$url ="https://portal.rimscout.com/<tenant>/api/alerts" # replace with your URL
$key = "<access token>" # replace with your access token
$authheader = New-Object "System.Collections.Generic.Dictionary[[String],[String]]"
$authheader["X-Access-Token"] = "$($key)"
$authheader["Accept"] = "application/xml"

# request Rimscout for active alerts
[xml]$request = Invoke-RestMethod -Uri $url -Headers $authheader

# build XML structure for the custom sensor in PRTG
$XMLOutput = "<prtg>`n"
    $XMLOutput +="<result>`n"
        $XMLOutput +="<channel>Active Alerts</channel>`n"
        $XMLOutput +="<unit>Custom</unit>`n"
        $XMLOutput +="<customUnit>Active Alerts</customUnit>`n"
        $XMLOutput +="<mode>Absolute</mode>`n"
        $XMLOutput +="<float>0</float>`n"
        $XMLOutput +="<value>$($request.rimscoutapi.countactive)</value>`n" # the number of active alerts in Rimscout
        $XMLOutput +="<LimitMode>1</LimitMode>`n"
        $XMLOutput +="<LimitMaxWarning>0</LimitMaxWarning>`n" # create warning if there is at least one active alert
    $XMLOutput +="</result>`n"
    if ($request.rimscoutapi.countactive -eq 0) {
        $XMLOutput += "<text>Script last run at $(Get-Date -Format 'd.M.yyyy HH:mm:ss')</text>`n"
    }
    else { #provide further information about the active alerts, if there are any
        $XMLOutput += "<text>"
        foreach ($alert in $request.rimscoutapi.alerts.alert) {
            $XMLOutput += "$($alert.name) - $($alert.lastHealthStatus) - Since $($alert.activeForMinutes) Minutes;"
        }
        $XMLOutput += "</text>`n"
    }
$XMLOutput += "</prtg>"
return $XMLOutput
exit
Info
Learn more about custom PRTG sensors.
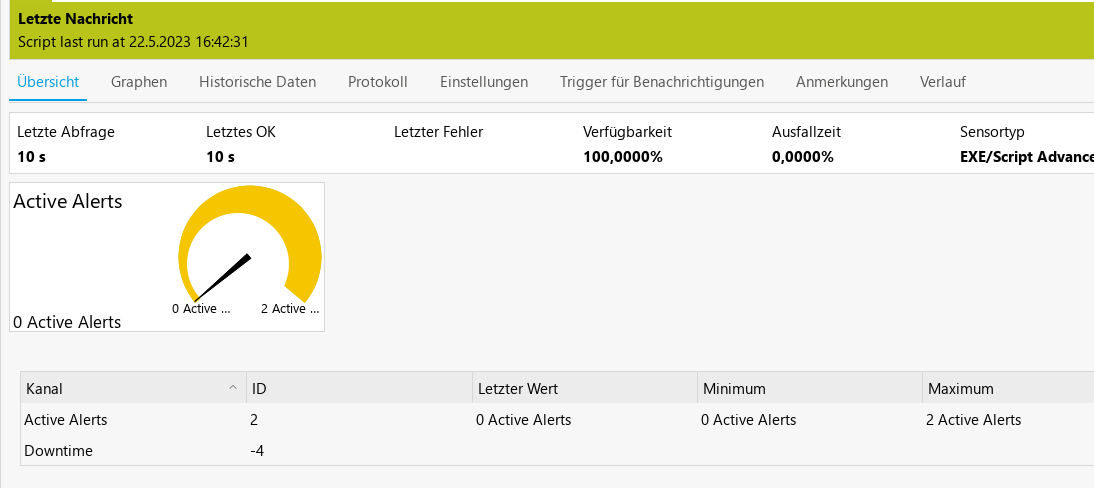
3) Create new sensor
- Choose a device in PRTG and create a new sensor for it.
- Select EXE/Script Advanced as sensor type
- Set the script for the entry EXE/Script under
Sensor settings. - Set the Scanning interval to 10 or 15 minutes.
- Set the remaining settings according to your needs.