Health
The health is an indicator whether a test, service, client or location has issues. By navigating to the Health section in the portal, users can access the health charts that visualize the health of your clients. The charts provide an overview of any current or past issues and allow users to drill-down and locate the area of issues.
Health status
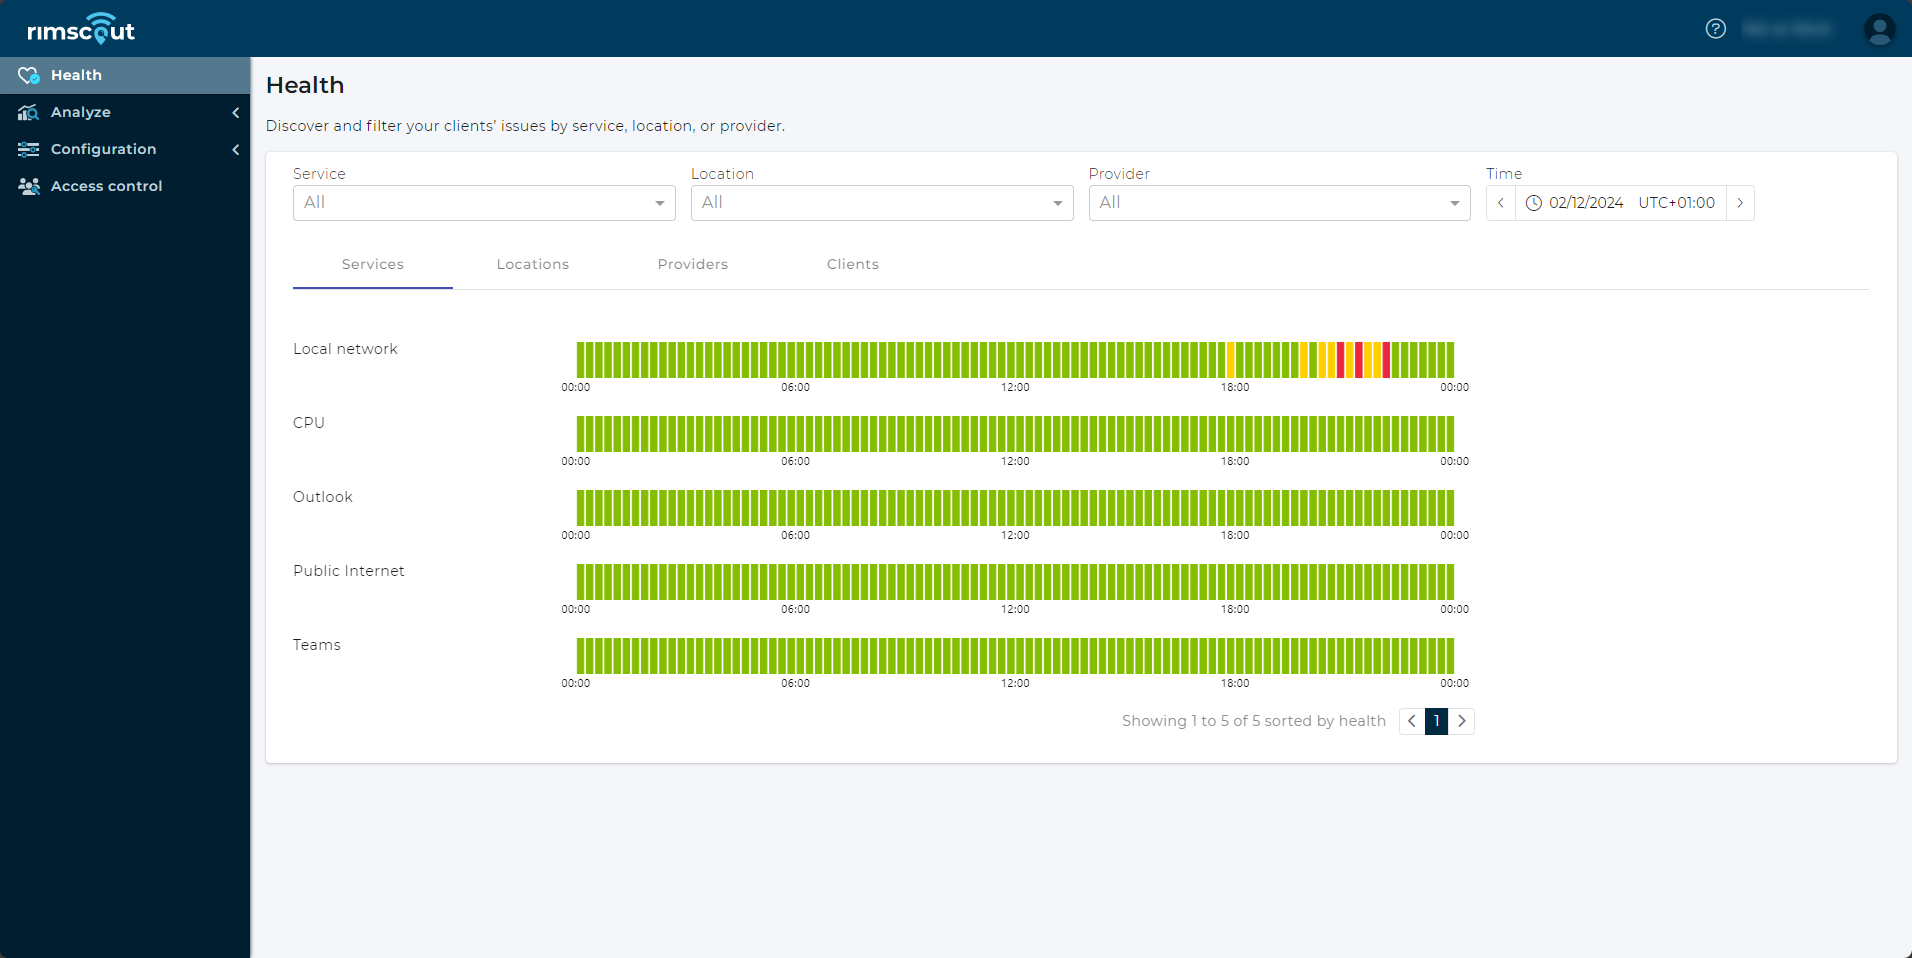
The health status is categorized into four states: Success, Warning, Critical, and Error. These states are determined based on measurements obtained from test executions performed by clients. While each individual test execution receives a status based on configured thresholds, the health calculation aggregates these results over time and, depending on the health chart, over multiple clients.
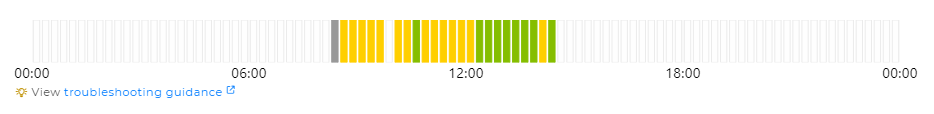
The health status for a service, location, client or provider is indicated the by the colored columns. Green corresponds to Success, yellow to Warning, red to critical and error is shown as grey.
If the health status is not Success, it indicates that clients report issues for a test. A Warning status suggests notable measurements that may not necessarily result in issues for the user. However, if the measurements reach a Critical state, it indicates potential impacts for the user. In the case of an Error status, the client was unable to execute a test. Further investigation into the reasons for an error can be performed on the test result chart.
Usage
The health charts show you possible issues and allow a drill-down into the data. Hover the health charts for details and possible actions.
Grouping
The health chart of each tab show the data grouped by services, locations or providers. The last tab Clients lists all your clients that reported data for the selected time and filters.
Filtering
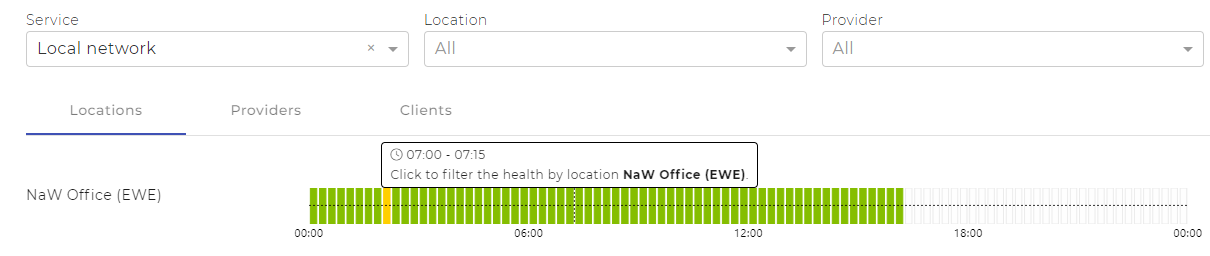
If you identify e.g. a location with issues, click on the health chart to filter the data for this location.
Alternatively, use the dropdowns at the top to filter for services, locations, or providers.
Time selection
The health page shows the current day’s health by default. To view any past data use the datetimepicker at the top right.
Client details
The clients tab lists all your clients that reported data for the selected time and filters. Click on a client's health chart to navigate to the client page with more details.
Average latency
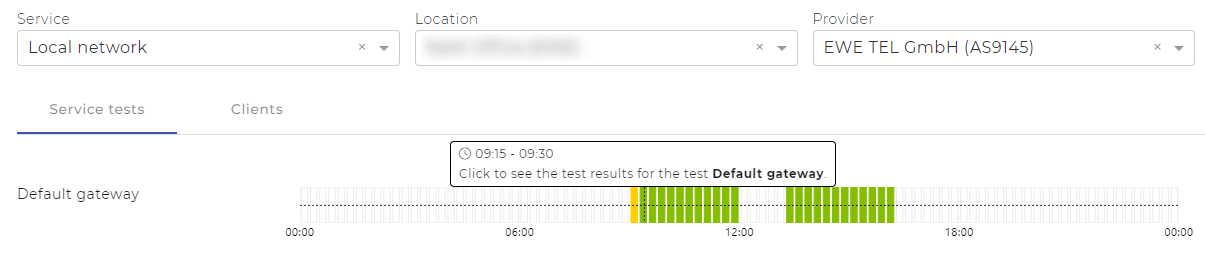
Filter data for a location, service, and provider to see the Service tests tab.
Then click on a test’s health chart to view the average latency of the selected location and test.
Troubleshooting guidance
For services with issues, links to troubleshooting guidance are provided under the health charts. Follow these for solutions or next steps.